The Dashboard tab turns your work orders into business intelligence: revenue, payments, outstanding balances, and profit — no spreadsheet required.
Key Metrics at a Glance
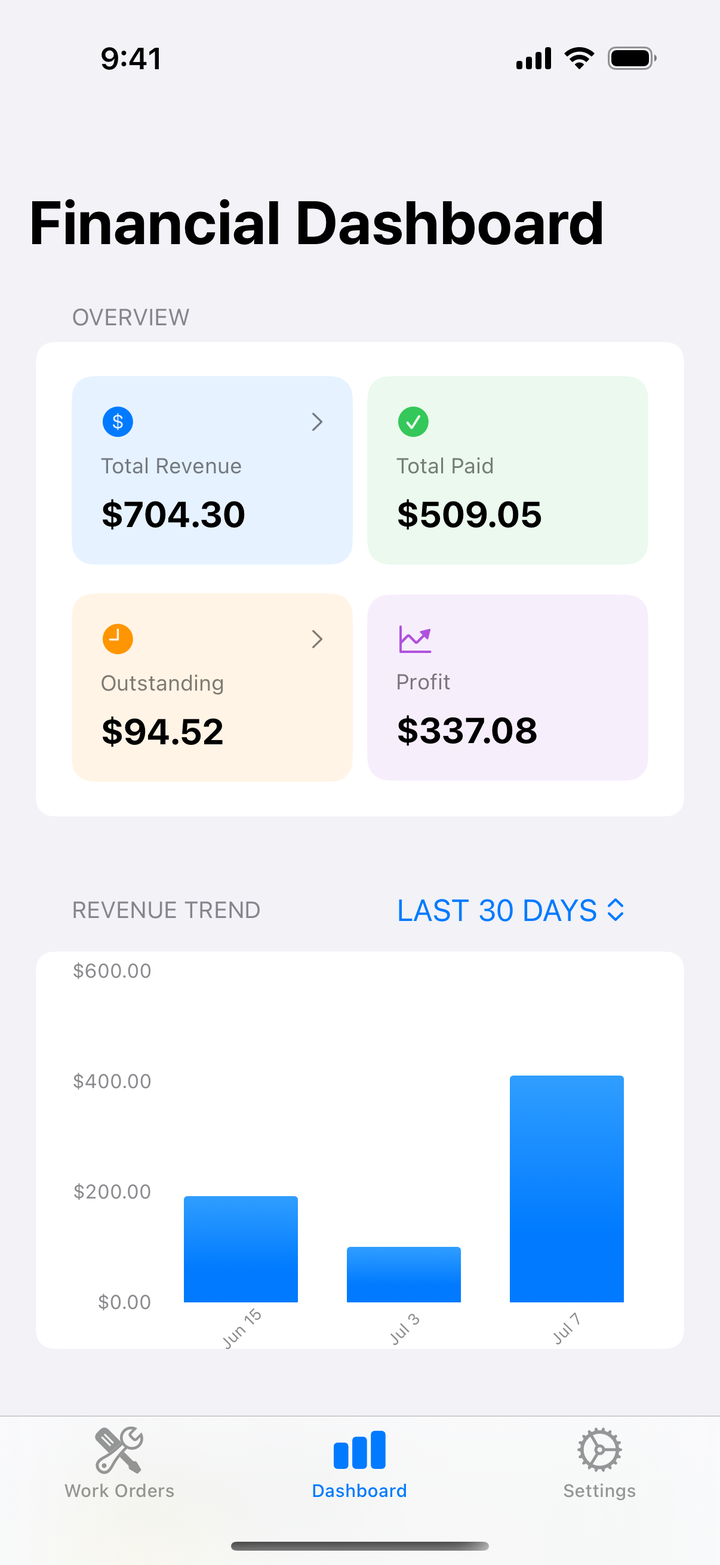
| Metric | What it tells you |
|---|---|
| Total Revenue | All completed work in the selected period |
| Payments Received | Money actually collected |
| Outstanding | Unpaid balances still owed to you |
| Profit | Revenue minus your parts costs |
Pick Your Time Range
Every view can be scoped to: Last 7 Days, Last 30 Days, Last 90 Days, Last 12 Months, Current Year, or All Time.
Revenue Trends
The revenue chart shows how your business moves over time — spot your busy seasons, slow weeks, and growth at a glance.
Outstanding Balances
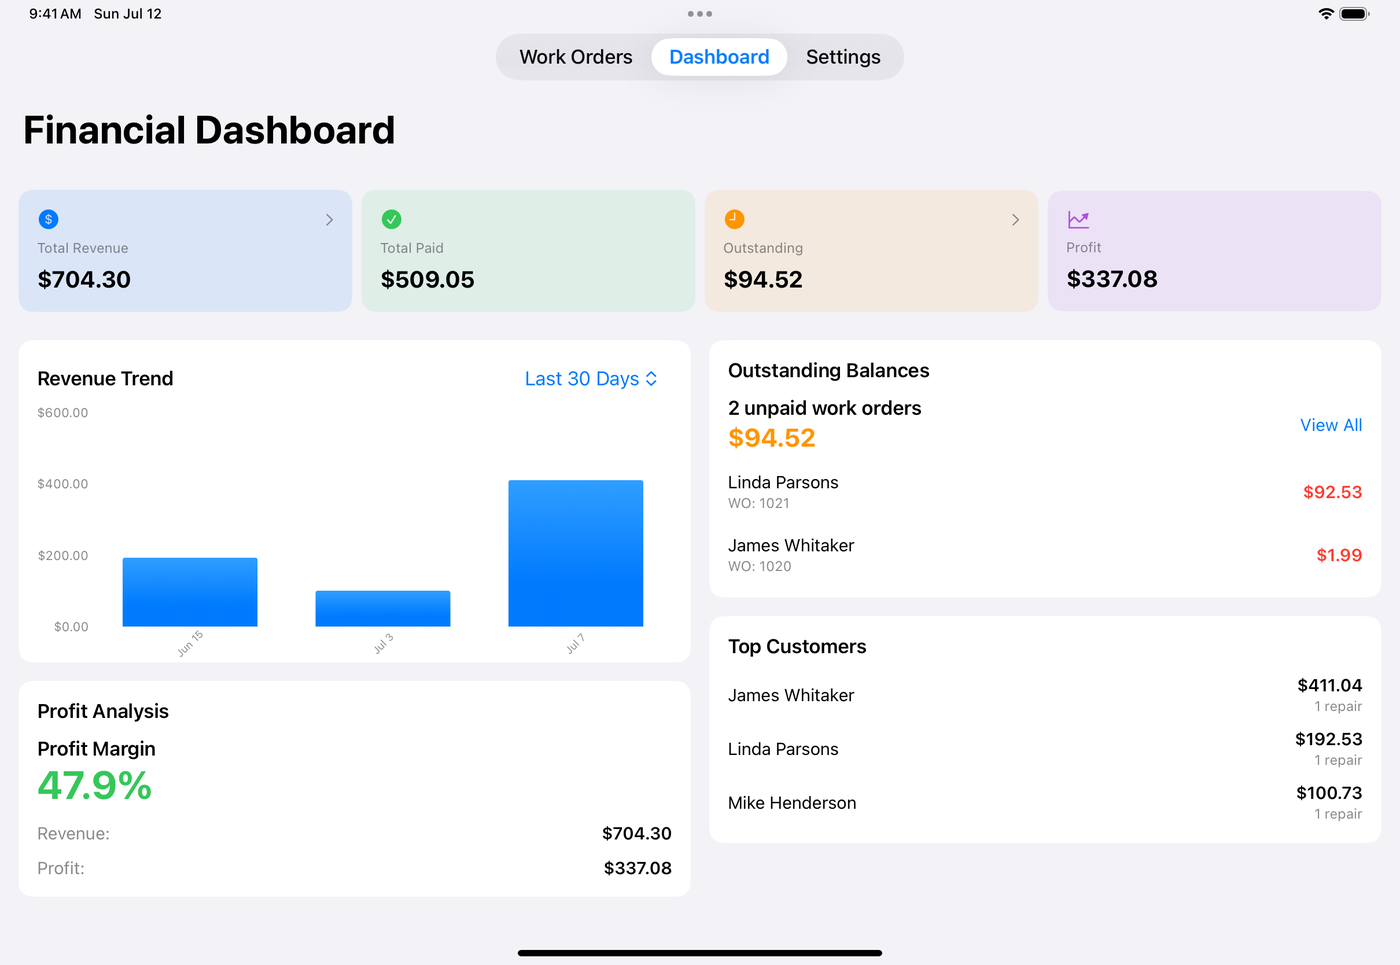
See every work order with money still owed, so following up is a glance instead of an audit. Balances also appear on each work order’s Financials section, and the Payment Received status prompt helps keep this list honest.
Profit Analysis
Profit = revenue − parts cost (your labor is the product). Reviewing profit by period tells you whether your parts markup and labor rate are actually working. If margins sag, the fix is usually one of those two settings.
On iPad
The Dashboard uses a two-column layout on iPad, so charts and summaries sit side by side — a genuine business dashboard on the workbench.
Tips
- Check Outstanding weekly — the sooner you follow up, the faster you’re paid
- Record payments immediately — the dashboard is only as honest as your inputs
- Compare periods — this 30 days vs. the year’s trend shows momentum
- Watch profit, not just revenue — busy and profitable are not the same thing